

By Sushant Alevoor
Introduction
Operating Model Design weighs many considerations: strategic alignment, structure, processes, incentives, technology, people and culture. Friction, whether within these elements or between them, is rarely one of them. It surfaces during implementation, where the people inside the system absorb it. When it is severe, the transformation or reorganization fails and the team returns to the drawing board.
This article argues that friction deserves a place among the other lenses used during design, so that an Operating Model is stress-tested before launch rather than found fragile after it. I demonstrate this through a case from a business unit that had laid out a strategy to pivot toward proactive sales but was undone due to friction.
Defining Friction
Much of what is written about friction comes from UX design. For Operating Model Design, I define it as an organizational fault line: a point of incompatibility, within a function, team, platform or culture or between two of them, where parts of the organization were never built to work together. Like a geological fault line, it can sit unnoticed for years and reveal itself only under stress, such as a surge in volume or a high-stakes deal.
Friction is not the same as inefficiency, latency or a bottleneck. These are symptoms. Designers usually measure the symptoms, but friction can stay hidden until stress arrives.
Why Analyze Friction During Design?
I call the map of friction across an Operating Model’s components, such as structure, processes and technology, its Friction Topology. Deriving it during design shows where the model is likely to fail under stress, so the organization can decide which frictions to accept and which to fix.
Doing this during the Design phase gives the organization time to think through what it would do if the moment of stress arrived. Without it, the organization is caught unawares, scrambles for quick fixes and ends up applying a sub-optimal one for want of time. Friction analysis thereby makes the Operating Model more efficient and effective, and also more resilient in the long run, during steady state execution.
Conducting a Friction Analysis
Friction Analysis follows three steps, which I demonstrate using a case I was part of.
Case Study: Turning a Sales Organization Proactive
A business unit was dealing with large volumes of RFPs from clients. The volumes were high but the value of each deal was low, and the effort it took was very high. The win rate was low because the organization was too busy with smaller RFPs. There was little time left to understand the customer’s real needs. It decided to pivot to a “proactive” strategy, with salespeople talking to clients and working toward pre-empting the RFP process. But this was a complex organization with a maze of overlapping products and offerings. The salespeople needed help making sense of them and packaging them into a solution with a compelling narrative. Every strategy needs an operating model, and the business unit chose a Center of Excellence (CoE) to deliver it. The CoE was given three objectives:
- Staying in constant contact with internal capability practices to discover their products and offerings
- Meeting regional sales heads to understand the challenges of clients in their regions
- Helping craft compelling propositions to take proactively to the client
Step 1: Discover the Current Operating Model
The CoE was meant to operate as a “hub” driving proactive opportunities. Salespeople worked out of regional “spokes,” in the countries where prospective and existing clients were located. The CoE itself sat where most of the capability practices were, which also happened to be a low-cost location. It was formally launched, announcing the change to the regional spokes. Periodic meetings were set up so that the CoE and the salespeople could exchange insights and progressively drive proactive opportunities. The whole initiative was brought under the Chief Sales Officer of the business unit. The diagram below shows how the CoE was structured:
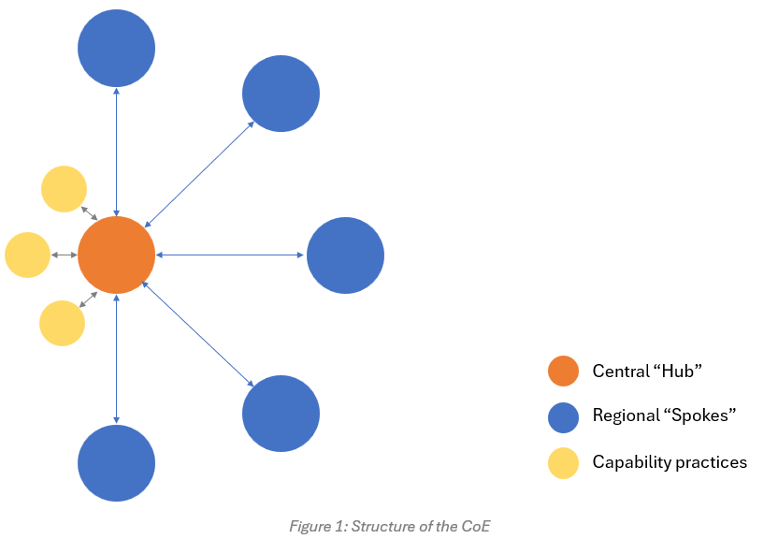
With this design in place, senior leadership expected two things to happen. First, they wanted the number of proactive deals to grow relative to RFP-led ones. Second, they wanted the proactive deals to grow progressively in size. Neither expectation was met. To understand what went wrong, we’ll need to look back at this case through the Friction Lens, as a post-mortem.
Step 2: Derive the Friction Topology
Deriving the Friction Topology means viewing the current Operating Model through the Friction Lens to expose its fault lines. The nine categories below act as identifiers for friction nodes:
- Distance: People separated by location, time zone or language
- Team Boundaries: Handoffs where work stalls before it is picked up and loses context
- Misaligned Ownership: One activity spread across two or more people, or one person handling two or more important activities
- Unclear Decision Owner: Decisions that are repeatedly escalated or negotiated for want of authority
- Misaligned Incentives: Incentives that do not support the strategy
- Tool Fragmentation: Multiple tools used for the same purpose
- Invisible Work: The gap between how work was designed and how it happens in practice, including tacit knowledge and undocumented workarounds
- Organizational Culture: Mistrust between units, low psychological safety and resistance to new ways of working
- Change Overload: Too many initiatives running concurrently without the Operating Model being adjusted to absorb them
Assessing the CoE against these categories gives us its Friction Topology, shown in the table below:
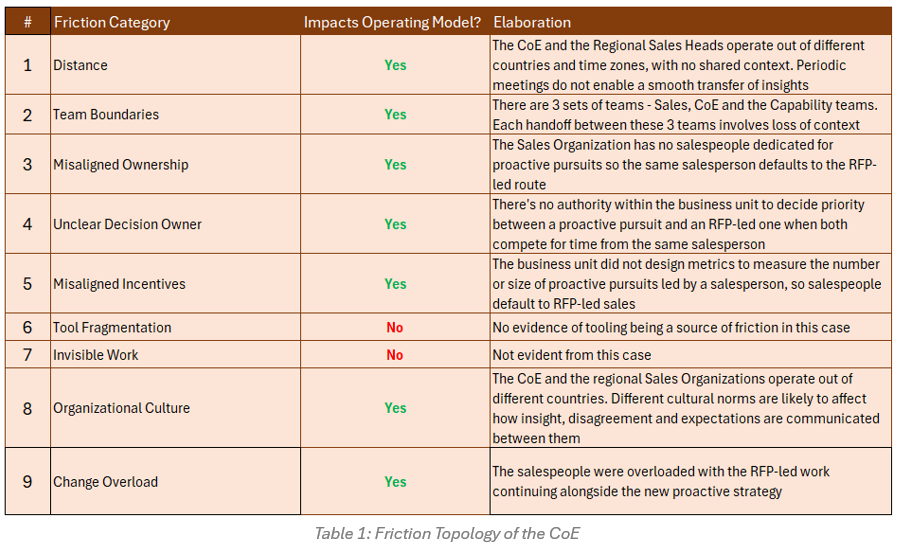
Having derived the Friction Topology, we proceed to the next step of deciding what to address.
Step 3: Decide What To Address
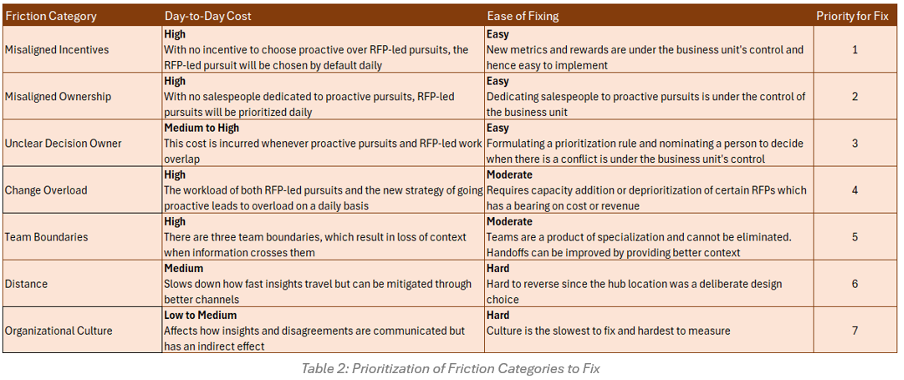
Step 3 ranks the friction categories to decide which fixes come first. Seven of the nine categories affect the CoE, so only those are ranked. Two criteria are used for ranking: day-to-day cost and ease of fixing.
- Day-to-day cost: How much the friction slows routine work, rated High, Medium or Low (a rating may fall between two levels)
- Ease of fixing: How simple and affordable it is to resolve, and how much of it is under the business unit’s control, rated Easy, Moderate or Hard
Categories that cost High or Medium to High day to day and are Easy to fix come first. Evaluating each friction category on these two criteria gives the table below, with the categories arranged in the order in which fixes could be applied to the Operating Model. Each of the cells carries an explanation for the rating.
Conclusion
Merely deriving the Friction Topology allows the organization to be aware of the underlying fault lines in the Operating Model it has designed. In this case, the business unit eventually scaled back its proactive strategy. Looking at it as a post-mortem, Misaligned Incentives, Misaligned Ownership and Unclear Decision Owner ranked highest. All three were also easy to fix and under the business unit’s control. Two of them, incentives and decision ownership, are as much governance gaps as design gaps. All three could have been found in the Design phase. Going a step further to think of how the organization would address each friction node goes a long way in building a robust Operating Model. Designers who stress-test their Operating Model through the Friction Lens during the Design phase get the chance to fix what it finds while there is still time.
Sushant is an Enterprise Transformation Architect with over 20 years of experience in complex financial institutions and large organizations. He has led design services at Goldman Sachs and held a senior role at Capgemini Invent. He holds the CBA, TOGAF Business Architecture Foundation and ASQ Lean Six Sigma Green Belt credentials. He writes on whole-system thinking in enterprise transformation.